Leading and Lagging Indicators: How to Measure the Progress of Product OKRs
Mar 25, 2025

Leading and Lagging Indicators: How to Measure the Progress of Product OKRs
Most Product Teams evaluate success by looking back—after the goal cycle is over.
But what if you didn’t have to wait?
What if you could start measuring progress while the work is happening—giving you clarity on what actions are working and where you need to adjust?
Building products is about learning and iterating. That requires metrics that guide you forward—not just ones that report after the fact.
Lags between your actions and results limit your ability to course-correct. That’s where the right indicators come in.
OKRs Help You Focus on Outcomes, Not Just Outputs
When used well, Objectives and Key Results (OKRs) help you define what success looks like—not just the tasks you plan to complete.
Objectives define the direction (what you want to achieve)
Key Results measure meaningful progress toward that goal
In Product Management, OKRs connect your Product Strategy to everyday Discovery and Delivery decisions. They help translate high-level goals into focused execution.
Naturally, most Product Teams gravitate toward big-picture metrics tied to themes like:
Monetization
User engagement
Growth
Customer satisfaction
Process quality
The Real Value of OKRs: Mid-Cycle Feedback
Setting goals shouldn’t only be about measuring success at the end of a quarter or fiscal year.
The biggest value of OKRs comes from regular check-ins—using progress to steer your actions, not just summarize them.
This is where many teams fall into OKR Theater—tracking impressive-sounding metrics that don’t help with real-time decision-making.

Why Product Teams Need Fast Feedback Loops
To get the most value from OKRs, Product Teams need metrics that respond quickly to their actions—not just metrics that summarize results after the fact.
That’s the only way to course-correct in real time and actually influence outcomes before the quarter ends.
What You'll Learn in This Article
Using Leading and Lagging Indicators in Product Management
Differentiating Leading and Lagging Indicators Through Context
Causation and Correlation in Lagging and Leading Indicators
Identifying the Right Leading Indicators for Your Product
Using Insights to Work Backward
Adapting Leading Indicators to Outcome OKRs
Moving Beyond Outcomes “by the book”
Takeaway: Prioritize Leading Indicators to Avoid Lagging Decision-Making
Using Leading and Lagging Indicators in Product Management
It’s a familiar challenge: Product Teams often set goals aligned with company-level priorities—like revenue or growth. But these high-level goals tend to move slowly.
By the time company-wide metrics shift noticeably, you’ve already launched the next initiative. And there’s no clear connection between your team’s actions and those results.
That’s why relying on lagging indicators alone makes it hard to track the impact of your work.
What You Can Influence More Directly
Fortunately, there are plenty of metrics that Product Teams can affect more immediately—at least in theory.
To make better decisions based on progress, you need metrics that lead you toward success, not just describe it afterward.
These are leading indicators—and they’re the key to making OKRs actionable during the cycle, not just at the end.
Leading Indicators Help You Predict Outcomes
They’re not always easy to identify. But the value is clear:
Leading indicators let you predict the future.
And while they take more effort to define, they’re well worth it.
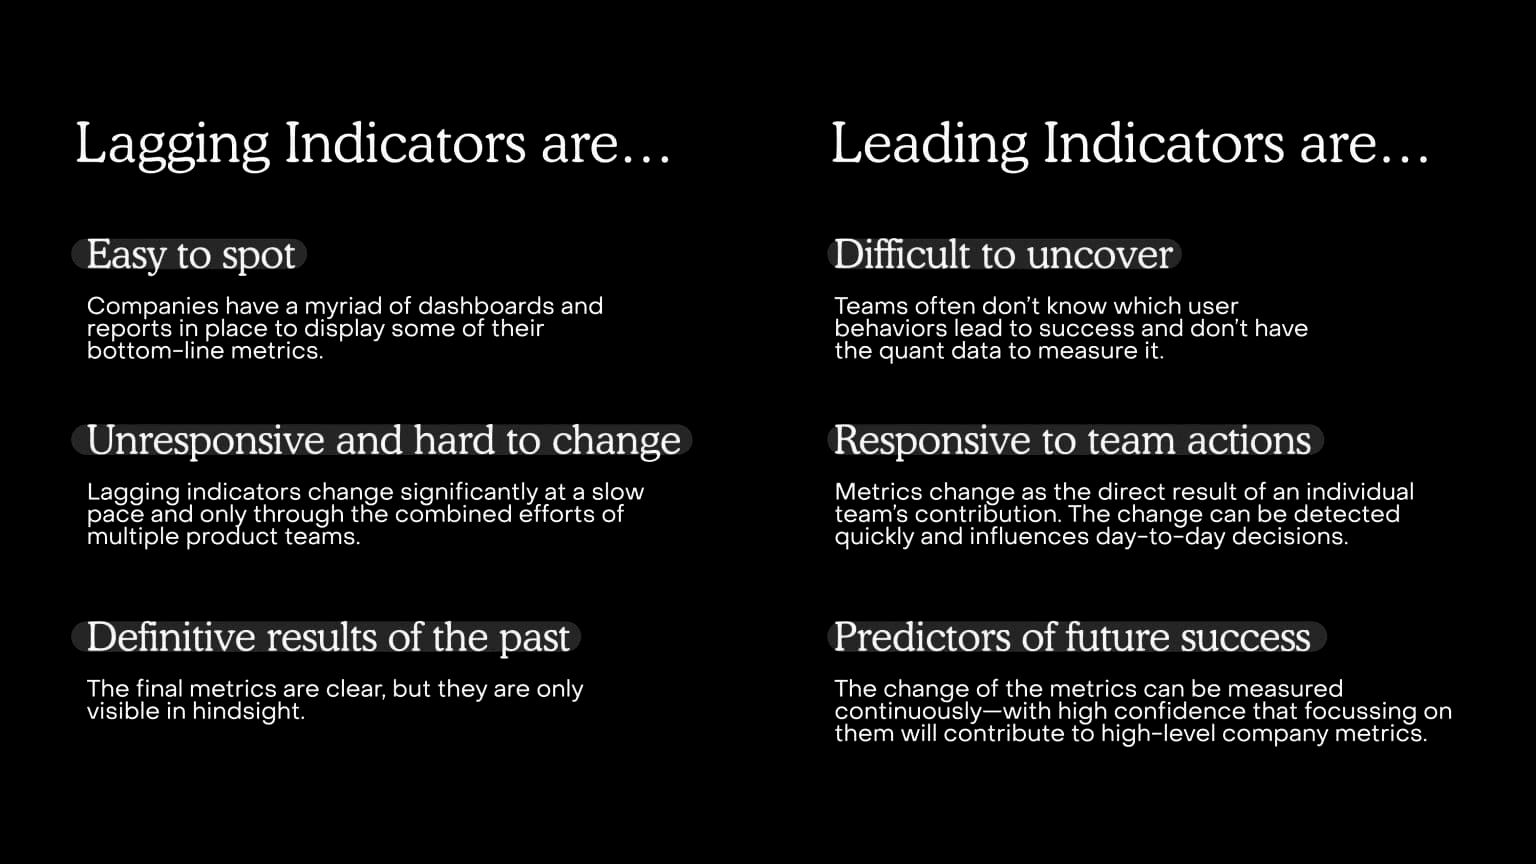
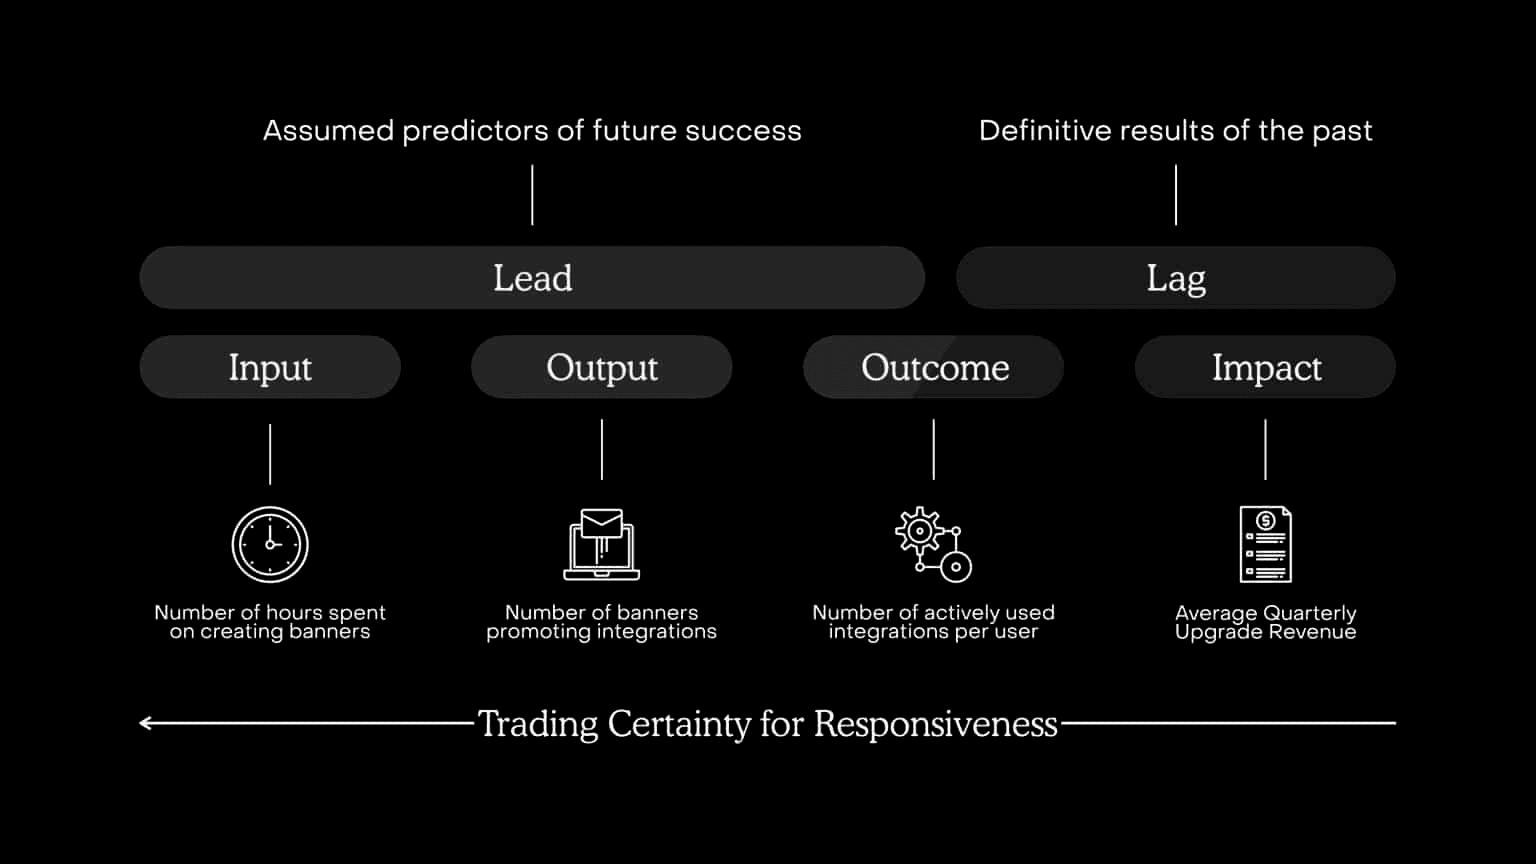
Here’s a simple summary of the difference between leading and lagging indicators:
Context Matters: Leading vs. Lagging Isn't One-Size-Fits-All
The differences between leading and lagging indicators become clearer with real-world examples. But remember—these are just that: examples.
What qualifies as a leading or lagging indicator depends on your team, your company, and your product.
Even widely used metrics like NPS or Churn—typically considered lagging—can take on different roles depending on how and where they’re used within your organization.
Focus on Relationships, Not Labels
The examples below illustrate the general relationship between leading and lagging indicators—not a universal rule for how you should define yours.
Your context will shape what makes sense.

There’s a Lot of Grey in the Leading vs. Lagging Conversation
Like much of Product Management, what looks black-and-white at first often turns out to be grey.
The distinction between leading and lagging indicators isn’t always clean—but having that separation still helps define more useful OKRs.
Let’s break it down.
Differentiating Leading and Lagging Indicators Through Context
The more accurate way to classify a metric as “leading” or “lagging” always comes down to context.
Sure, there are familiar patterns—certain Key Results are usually leading or typically lagging—but those labels don’t hold up without understanding how the metric is used in a specific setting.
A metric might be a leading indicator in one scenario—and a lagging indicator in another.
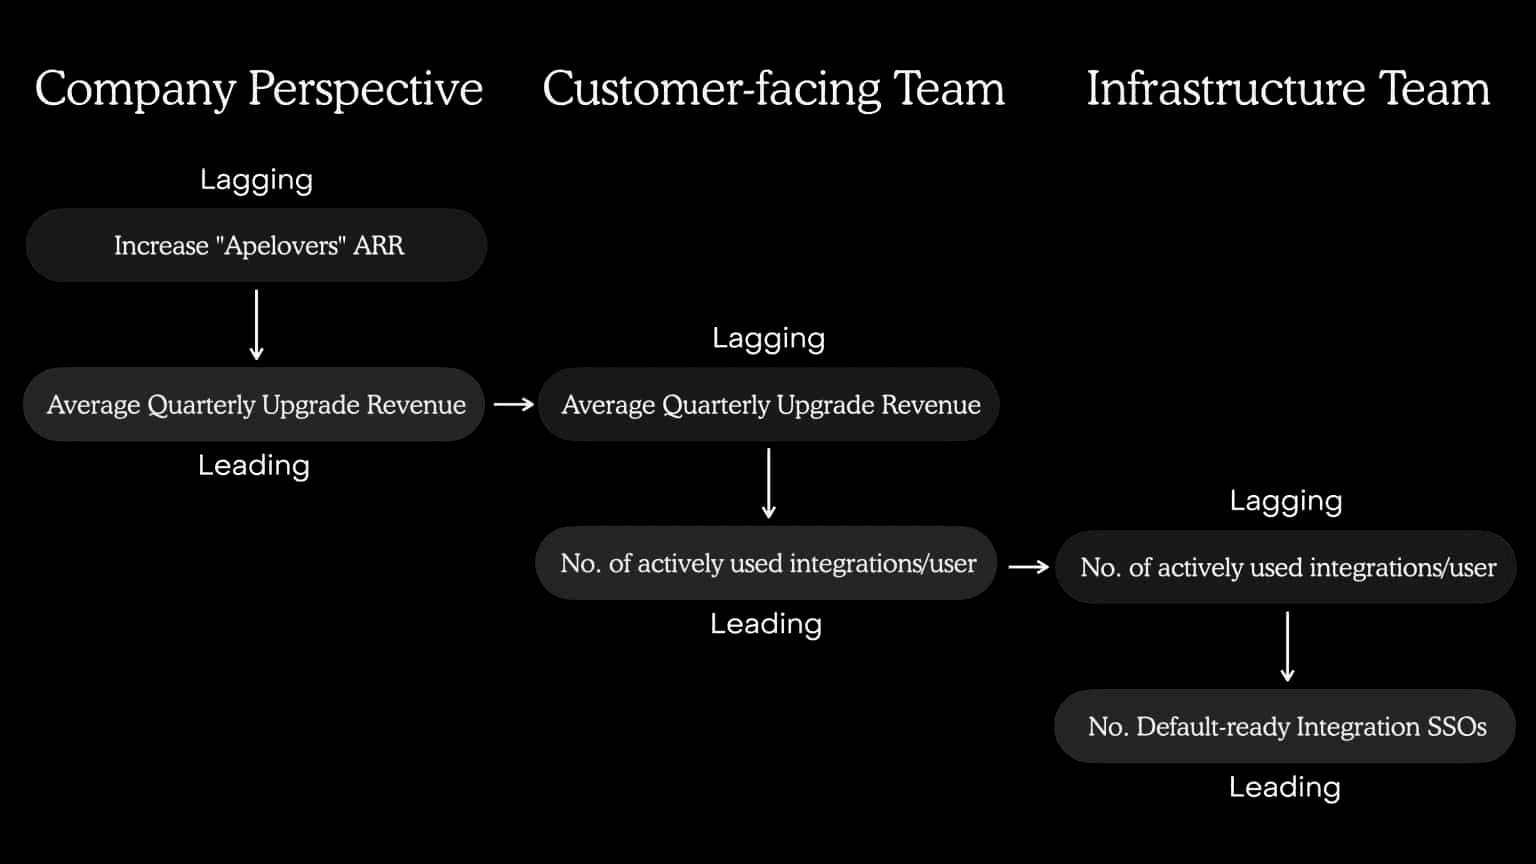
An Example: Postgorilla’s Email Integrations Team
Let’s say you’re part of a Product Team at a fictional email service platform, Postgorilla, working on their integrations marketplace.
The company-level strategy?
“Increase our best customers’ time and money investment in us.”
One of the corresponding Key Results might be:
“Average Quarterly Upgrade Revenue per Customer of $250.”
In this case, increasing ARR from heavy users (internally called “Apelovers”) would be the lagging indicator—the result measured after all the work is done.
The average quarterly upgrade revenue becomes a leading indicator at the company level, helping predict the likelihood of hitting that broader ARR target.
But That’s Not the Whole Story
From the integrations marketplace team’s perspective, that same “quarterly upgrade revenue” metric becomes a lagging indicator—because:
It’s only visible after the fact
It’s shaped by multiple teams’ work, not just theirs
So now they have to ask:
What behaviors can we influence directly and detect quickly?
Identifying Team-Level Leading Indicators
With that in mind, the integrations team might explore Discovery questions like:
What’s preventing lower-MRR power users from upgrading?
What would increase their usage of the platform without switching tools?
From those insights, they might define new leading indicators like:
“Number of actively used integrations per user”
“Time spent on integration setup”
These are early signals that their work is helping remove friction and increase customer value—leading toward the company-level impact.
But What If You’re an Internal Platform Team?
Context changes again if you’re on something like the Partnerships Infrastructure team at Postgorilla.
From your angle, even something like “No. of actively used integrations per user” might now be a lagging indicator—because your work enables, but doesn’t directly control, that metric.
One Team’s Leading Indicator Is Another’s Lagging One
Why does this shift happen?
Because not every team can influence every metric directly. What’s a leading indicator for one team might be a lagging indicator for another—especially when multiple teams’ efforts are required to move it.
For the Integrations Infrastructure team at Postgorilla, something like “actively used integrations per user” is lagging. It only changes after a chain of work—most of which lives outside their team.
So instead of borrowing another team’s metric, they need to find what they can control.
Identifying Relevant Leading Indicators Internally
By asking the same questions (What can we influence? What can we track regularly?), the Infrastructure team might land on indicators like:
“Number of default-ready Integration SSOs”
“Number of days without P0 Integration API outages”
These give them tangible signals that their work is supporting the broader product and platform goals—in a way they can actually act on.
Don't Default to Generic Leading Indicator Lists
Instead of relying on generic templates, evaluate your potential metrics based on context:
Can you influence it directly?
Can you track it regularly and make decisions based on it?
If the answer is yes, you’ve likely found a strong leading indicator. If not, work backward from your lagging indicators to uncover what signals could guide the way.
(Pro tip: the next section on Using Insights to Work Backwards will help with that.)
Other Ways to Evaluate Leading vs. Lagging
Here are a few more ways to separate the two in your specific situation:
How the metric is measured
For example, NPS might seem like a decent leading indicator in theory. But if it's only measured once or twice a year, it's lagging in practice—because teams can’t act on it in time.The level you’re measuring
Revenue and similar metrics work fine at the company or department level. But for Product Teams needing weekly feedback? Not so much.Trade certainty for responsiveness.
How you want to work
Are you measuring your team’s success only based on high-level metrics like NPS or revenue? Or are you enabling them to define—and be judged by—behavior changes they can directly influence?
When you zoom in on how your team operates, what they control, and how frequently they can measure success, you unlock the true power of leading and lagging indicators.
Causation and Correlation in Lagging and Leading Indicators
Lagging indicators like revenue growth have a clear upside: certainty.
You know what success looks like. You can prove your impact—eventually. But that clarity comes at a cost: It’s hard to change and slow to show up.
Leading indicators, on the other hand, are more nimble—but more indirect.
They often correlate to future success rather than directly cause it.
Example: Postgorilla's Integrations Team, Revisited
Earlier, the Postgorilla integrations team defined leading indicators they could act on in real time. But they could take that even further by identifying behavioral patterns that strongly predict positive outcomes.
These might include:
The Tradeoff Between Feedback and Certainty
Trying to move a lagging indicator like revenue connects your work to a hard outcome. It’s clear, measurable, and non-negotiable.
But it also moves slowly.
In contrast, working on a more responsive metric—like page views—gives faster feedback but doesn’t always tie clearly to more strategic results like revenue.
You trade responsiveness for certainty—and choosing the right balance is the real challenge.
Identifying the Right Leading Indicators for Your Product
Swapping certainty for responsiveness is key to creating an efficient, feedback-driven build–measure–learn cycle.
Let’s go back to the Postgorilla example.
Imagine that during this cycle, the company is focused on subscription revenue. That revenue is driven by:
New customer acquisition
Upsells from existing users
Churn reduction
Here’s the catch:
Each of those drivers requires input from multiple teams, across different departments, and may only move at the end of a quarter—or even a year.
The Integrations Team Faces Two Challenges
From within their department, the integrations team now faces a familiar dilemma:
They understand where their department’s work fits into the company goals—but they can only measure their impact in hindsight.
They could create more responsive team-level metrics—but those wouldn’t visibly move the needle on company OKRs.
This is the classic Product Management tradeoff:
Balancing the certainty of company-level metrics with the responsiveness of team-level indicators.
Look Beyond Product Metrics Alone
Here’s the good news:
Not every leading indicator has to be an in-product metric.
Sometimes, the right metrics come from behaviors, experiments, or even operational signals—things that help the team respond rather than wait.
To move in the right direction, Product Teams can start with a simple shift in thinking:
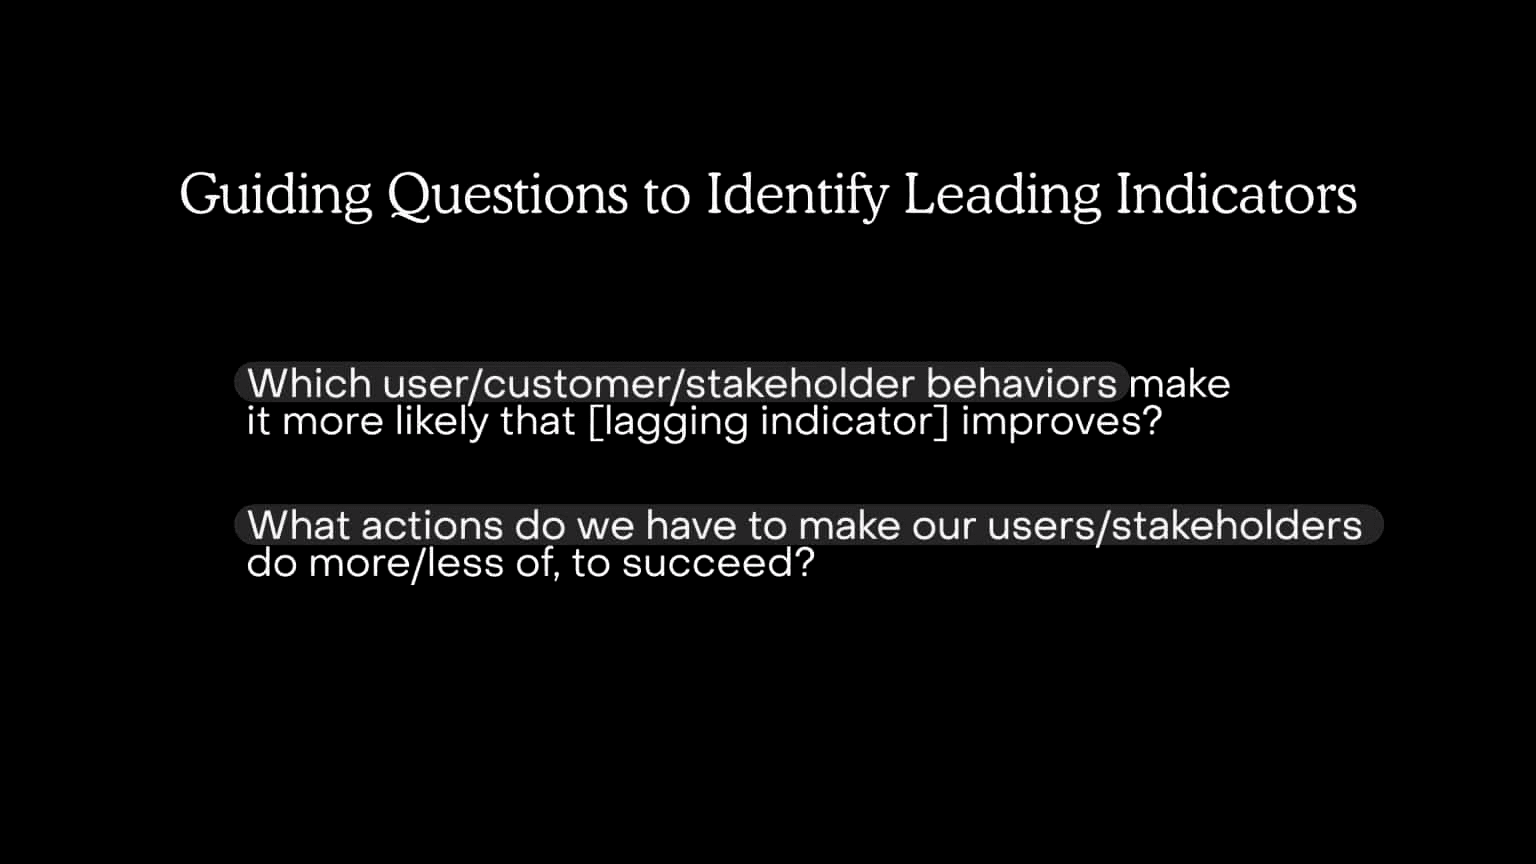
Instead of searching for the perfect leading indicator, ask the right questions to uncover a useful one.
We’ll get into those guiding questions shortly.
Shift Your Perspective Beyond the User
One important mindset shift when identifying leading indicators is to look beyond just user-facing metrics.
Especially for teams working on products with limited quantitative data, it helps to consider actions and behaviors from internal stakeholders or team members as potential sources of insight.
A broader perspective can surface useful leading indicators faster—and often in more actionable forms.
A great framework to support this thinking is Impact Mapping, particularly its idea of categorizing “Adjacent Actors.” These are people or systems connected to your product’s outcomes—even if they’re not direct users.
Using Insights to Work Backward
From a Product Team’s perspective, identifying leading indicators is often about working backward.
Start with the obvious lagging metrics—the ones already in plain sight—and trace them back toward behaviors or events your team can directly influence.
Example: Postgorilla’s Integrations Team
Instead of starting with an upsell event, which happens well downstream, the integrations team at Postgorilla might begin with something more immediate:
Active use of integrations.
Yes, it’s still technically a lagging metric—but it’s much closer to their own work and therefore more actionable.
From there, the team can use guiding questions to identify more granular, leading indicators—those that:
A. Are directly tied to the team’s work
B. Help predict future success (e.g. increased integration usage = more upsells)
C. Are likely to change throughout the current goal cycle
The goal is to land on indicators that help the team respond—not just report.
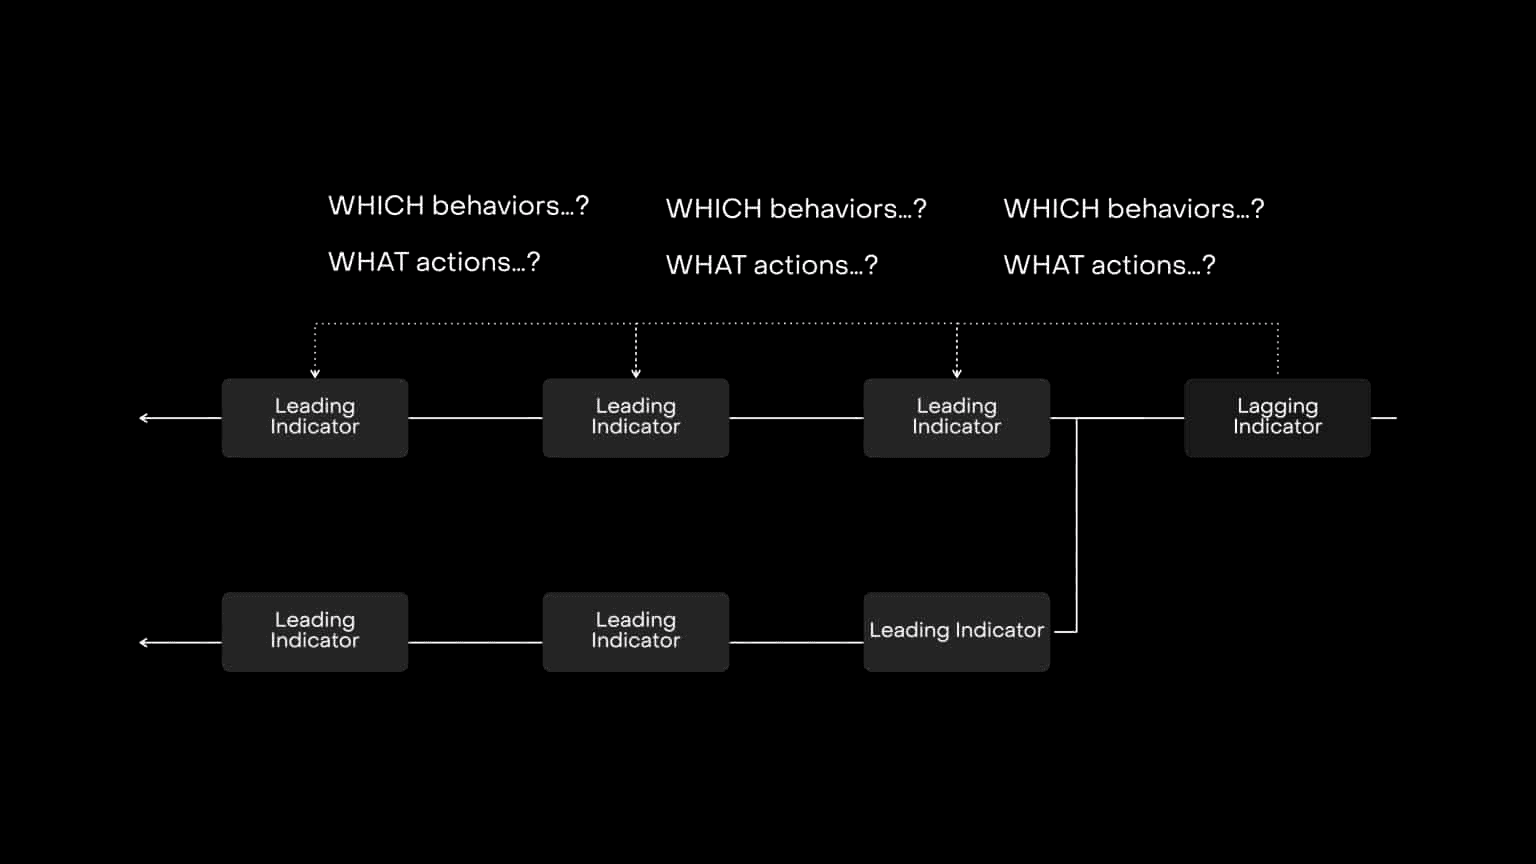
Visualizing the Process: Working Backward from Lagging Indicators
This diagram illustrates how you can work backward from a lagging indicator to uncover a set of leading indicators.
Each branch in the diagram represents a different theme or contributor that might feed into the same high-level outcome.
The idea is to give space to multiple paths—each representing distinct behaviors or systems that drive progress toward a shared goal.
Example: Different Paths to the Same Outcome
One branch might reflect customer behaviors from a marketing journey
Another might follow the sequence of technical backend processes
A third might point to operational improvements or internal workflows
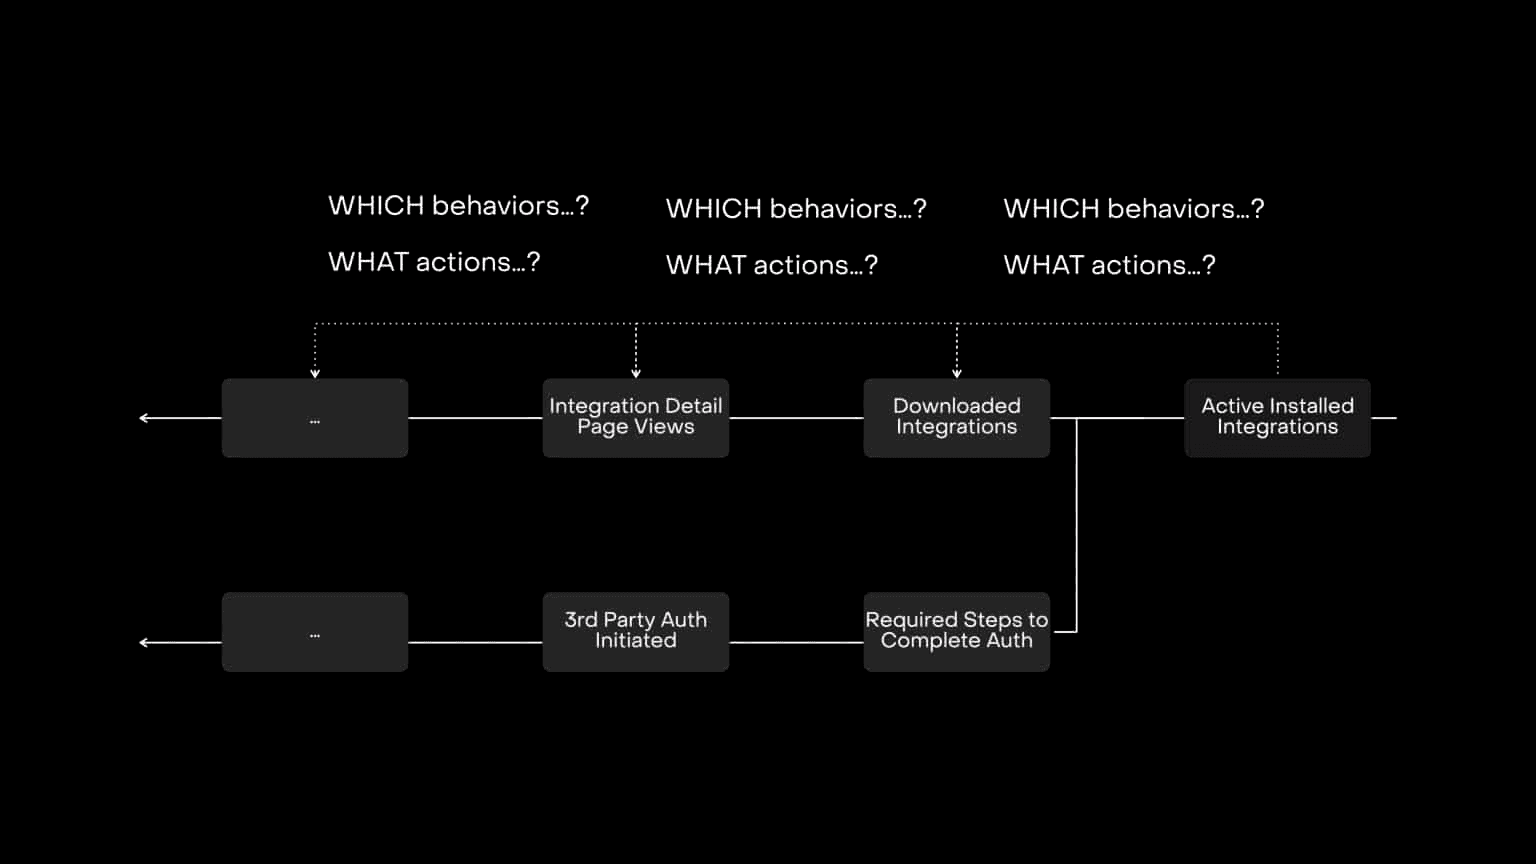
Postgorilla’s Integrations Team Example
If the team at Postgorilla goes through this exercise, they might end up with a list of actionable, team-level leading indicators—each aligned to a specific aspect of their work that contributes to the bigger picture.
Why This Exercise Matters
Going through this kind of backward mapping exercise gives your team a broader perspective on potential leading indicators—while also helping you assess which ones actually make sense for your team to own.
For example, your team should lean toward indicators they can directly control, rather than those that rely heavily on another team’s actions. Otherwise, the metric may quickly become lagging in practice.
The point of this process isn’t to set ambition levels or targets yet.
It’s to identify predictive, team-relevant metrics that could drive future success.
Moving from Indicators to Action
Once you’ve picked an indicator to explore, the next step is understanding the core problem that prevents users, customers, or stakeholders from taking the desired action.
That’s your problem space—and it’s what should guide your Discovery, validation, and solution development work.
The goal is to use your chosen leading indicators to measure the impact of that work as you go.
There’s No One-Size-Fits-All Model
This approach will look different depending on:
Your product
Your team’s structure
The data you have available
But the core principle remains the same:
Focus on metrics you can directly influence, and that change fast enough to allow mid-cycle course correction.
Adapting Leading Indicators to Outcome OKRs
Using OKRs already presents its own challenges—especially for Product Teams juggling Product Strategy, Discovery, and Delivery decisions.
But one of the most persistent struggles?
Choosing Key Results that balance tactical tasks (Outputs) with behavior changes that drive real results (Outcomes).
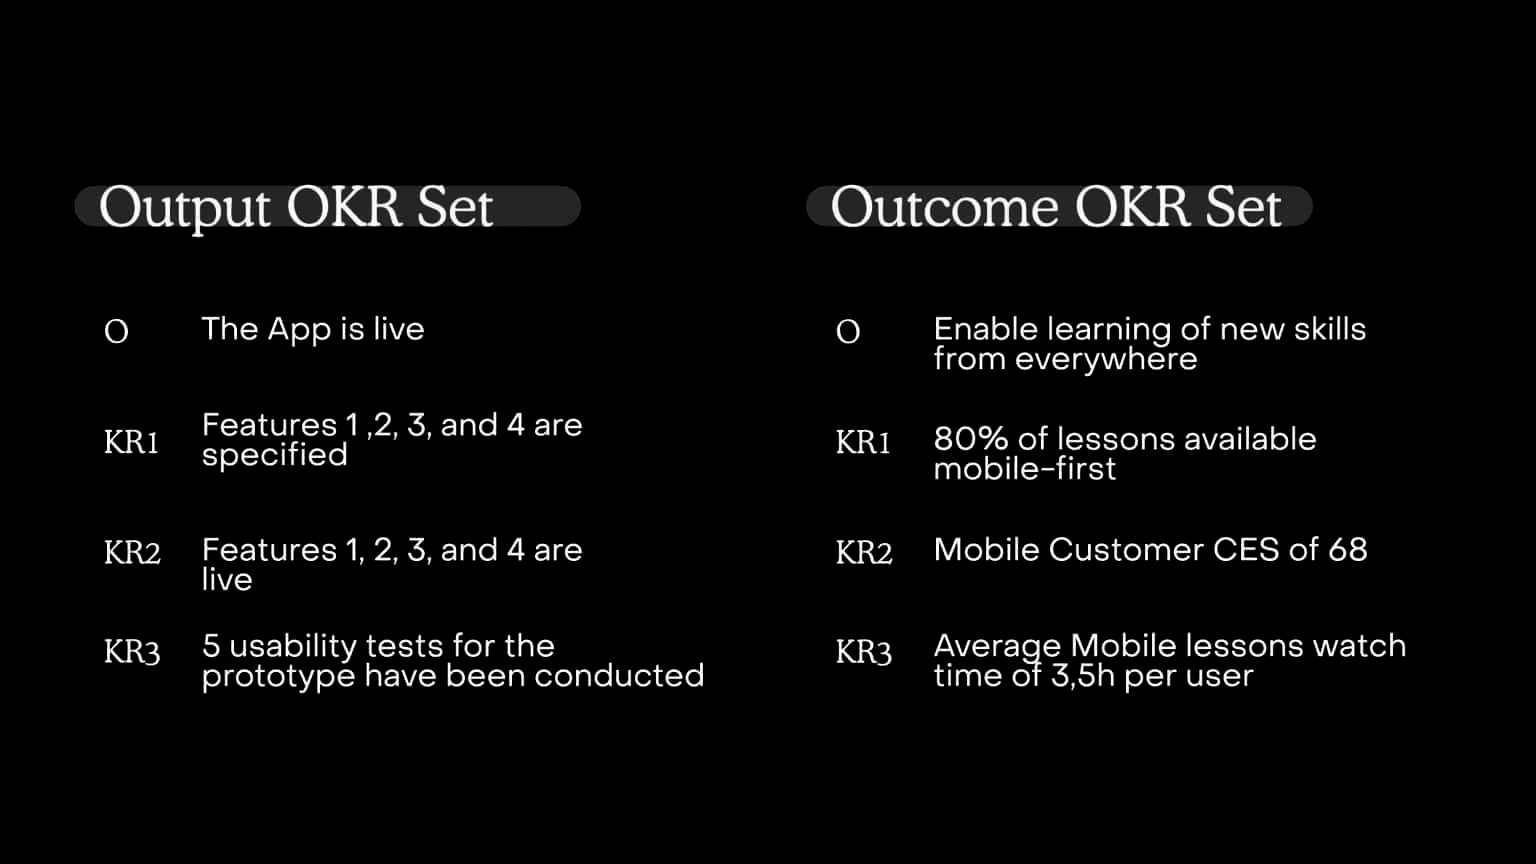
The Output vs. Outcome Distinction Matters
If you’re used to thinking of OKRs as a single, guiding metric, it can be tough to split them into Outputs and Outcomes.
But making this distinction is key.
It helps your team decide what to work on next (Outputs) and how to measure progress (Outcomes).
Getting clarity on both sides of this equation makes it easier to stay focused—and adapt your actions based on what actually drives results.

From Outputs to Outcomes: Ask “Why?”
One of the simplest—and most effective—ways to shift from Output-based Key Results to more Outcome-oriented ones is to ask:
“Why?”
Take this example:
“Do a Competitor Analysis.”
→ Why?“To create more app ideas.”
→ Why?“To drive engagement among our mobile users.”
This simple chain helps teams move past the task itself and focus on the impact they’re trying to create.
Add a Second Dimension: Leading vs. Lagging
But if your goal is also to find Key Results that are more leading than lagging, asking “Why?” alone isn’t enough.
You also need to consider how responsive the metric is—and how quickly it reflects change.
This added dimension helps build a shared understanding within your team about not just what you're tracking—but how soon you'll know if it's working.
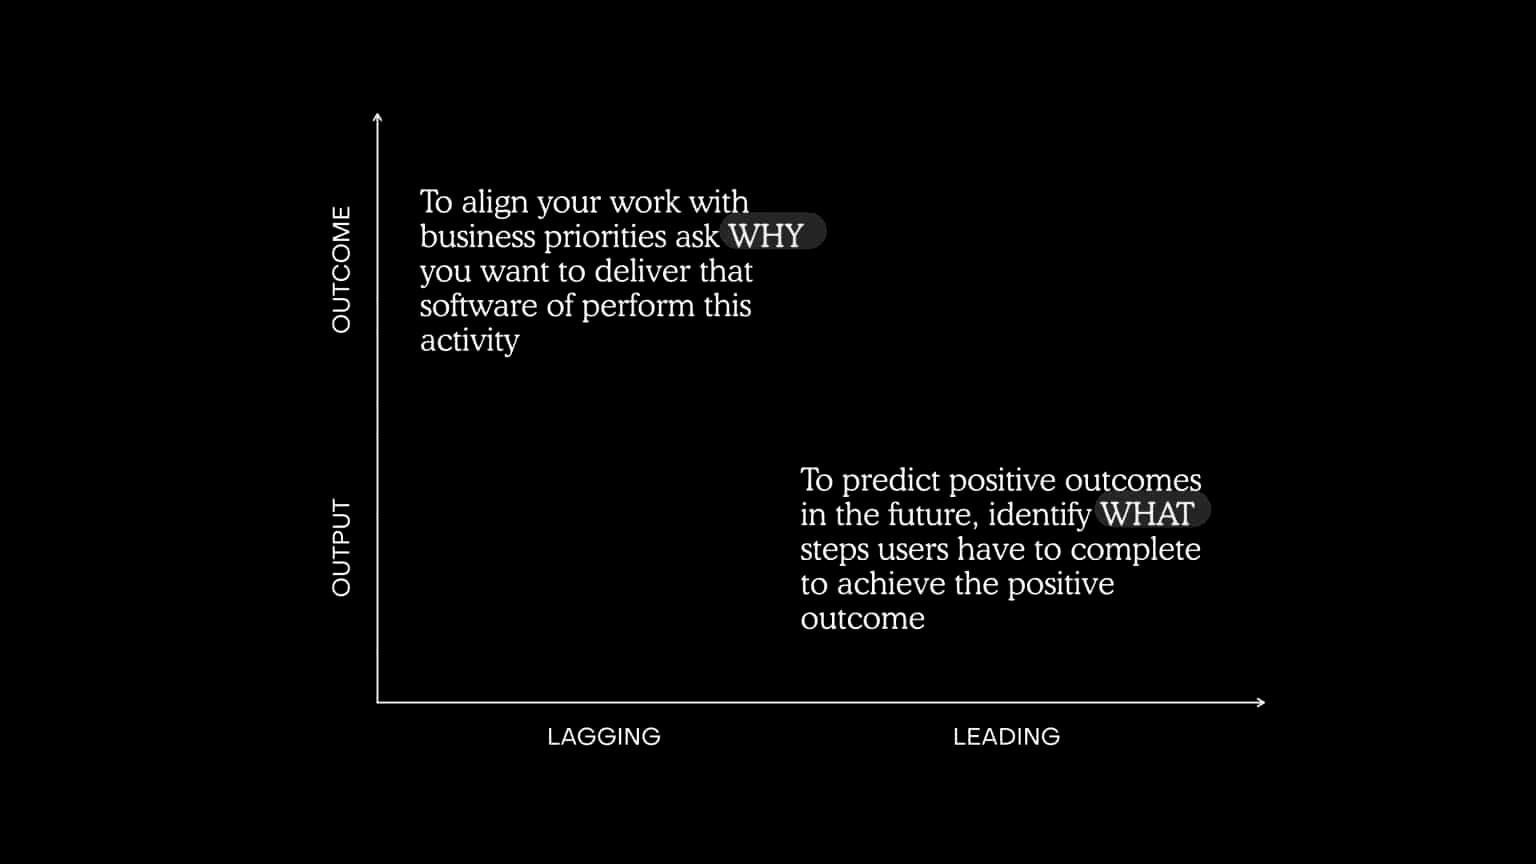
A Practical Tool, Not a Prescription
The visualization above is designed to help you navigate between different types of Key Results—not to tell you what’s right or wrong.
This matrix isn’t about dogma. It’s about making informed trade-offs.
It helps your team evaluate which kinds of metrics are most useful for your specific context—and how they can help you measure progress as you work, not just after the fact.
A Real Example: Postgorilla’s Integrations Team
So, what might this matrix look like after an ideation session with the Postgorilla integrations team?
Here’s how they could map their brainstormed Key Results—across Outputs vs. Outcomes, and leading vs. lagging—to better decide which ones to pursue.
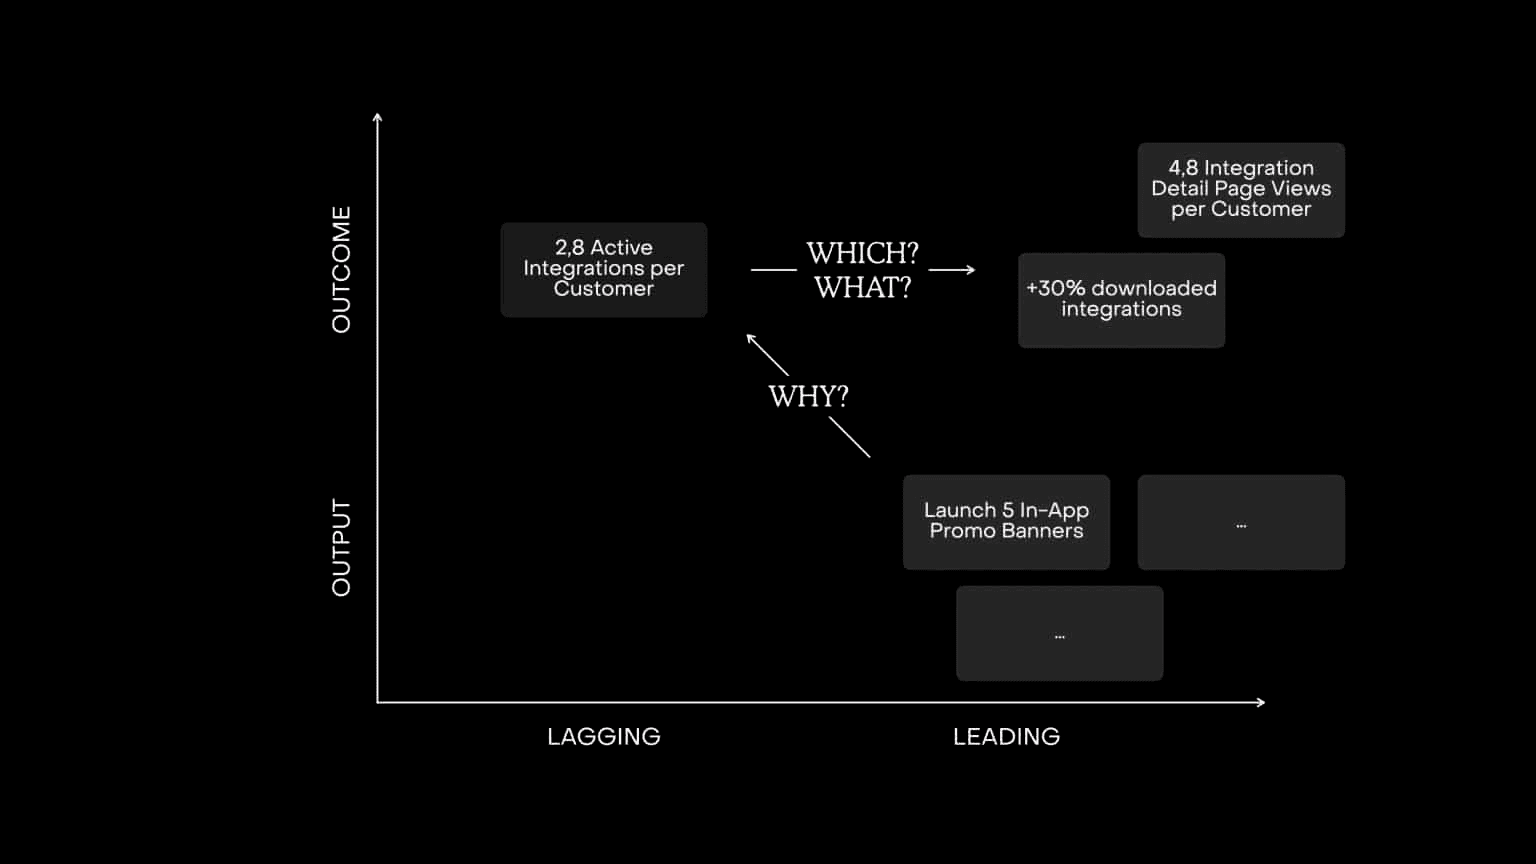
From Outputs to Outcomes: One Step at a Time
In the case of the Postgorilla team, their ideation started with leading but Output-oriented Key Results. To move toward a more Outcome-focused level, they asked a simple question:
“Why is this important?”
That helped them shift up the value chain—from tactical execution to meaningful behavior change.
At one point, they landed on a metric like:
“2.8 Active Integrations per Customer.”
Technically, that’s an Outcome Key Result—but it wouldn’t shift quickly enough to help guide their decisions within a single goal cycle.
So they pushed further, asking:
“What behaviors do our customers need to adopt more frequently for us to succeed?”
That led them to more leading-ish, yet still Outcome-oriented metrics—ones that were closer to their work and easier to act on mid-cycle.
Moving Beyond Outcomes “by the Book”
Outcome OKRs are great. They give Product Teams more autonomy and let them track real impact instead of just task completion.
But that doesn’t mean every Outcome metric is useful.
It’s entirely possible to define a behavior-focused Key Result that sounds good—but doesn’t move during the cycle or inform any decisions.
That’s why it’s essential to be aware of two things when shaping Key Results:
Are we discussing Outputs or Outcomes?
Are the metrics leading or lagging?
Because here’s the real question:
What’s the point of tracking a “perfect” Outcome if it can’t help you change course during the cycle?
Your goal-setting process shouldn’t be driven by templates or colorful quadrant diagrams alone.
Instead, it should be guided by your individual OKR system—and tailored to how your team works, delivers, and learns.
Takeaway: Prioritize Leading Indicators to Avoid Lagging Decision-Making
Leading indicators are a means to an end—not the end itself.
Collecting a long list of leading metrics won’t guarantee success. In fact, it can become a distraction if those indicators don’t actually help your team make better decisions.
But when used well, they’re incredibly valuable.
They help Product Teams measure the direct impact of their work, instead of waiting for slow, end-of-cycle feedback to catch up.
And most importantly, don’t treat this as a siloed activity.
Integrate this thinking into your existing OKR process. Use leading indicators as a tool to sharpen how you work today, not just how you report results tomorrow.